|
|
Randomization Tests: Two Conditions
Author(s)
David M. Lane
Prerequisites
Permutations and Combinations, One- and Two-Tailed Tests
Learning Objectives
- Explain the logic of randomization tests
- Compute a randomization test of the difference between independent groups
The data in Table 1 are from a fictitious experiment comparing an experimental group with a control group. The scores in the Experimental Group are generally higher than those in the Control Group with the Experimental Group mean of 14 being considerably higher than the Control Group mean of 4. Would a difference this large or larger be likely if the two treatments had identical effects? The approach taken by randomization tests is to consider all possible ways the values obtained in the experiment could be assigned to the two groups. Then, the location of the actual data within the list is used to assess how likely a difference that large or larger would occur by chance.
Table 1. Fictitious data.
| Experimental |
Control |
7
8
11
30 |
0
2
5
9 |
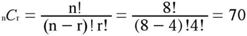
First, consider all possible ways the 8 values could be divided into two sets of 4. We can apply the formula from the section on Permutations and Combinations for the number of combinations of n items taken r at a time and find that there are 70 ways.
Of these 70 ways of dividing the data, how many result in a difference between means of 10 or larger? From Table 1 you can see that there are two rearrangements that would lead to a bigger difference than 10: (a) the score of 7 could have been in the Control Group with the score of 9 in the Experimental Group and (b) the score of 8 could have been in the Control Group with the score of 9 in the Experimental Group. Therefore, including the actual data, there are 3 ways to produce a difference as large or larger than the one obtained. This means that if assignments to groups were made randomly, the probability of this large or a larger advantage of the Experimental Group is 3/70 = 0.0429. Since only one direction of difference is considered (Experimental larger than Control), this is a one-tailed probability. The two-tailed probability is 0.0857 since there are 6/70 ways to arrange the data so that the absolute value of the difference between groups is as large or larger than the one obtained.
Clearly, this type of analysis would be very time consuming for even moderate sample sizes. Therefore, it is most useful for very small sample sizes.
An alternate approach made practical by computer software is to randomly divide the data into groups thousands of times and count the proportion of times the difference is as big or bigger than that found with the actual data. If the number of times the data are divided randomly is very large, then this proportion will be very close to the proportion you would get if you had listed all possible ways the data could be divided. The link below goes to a web page that can do these calculations.
Statkey
Please answer the questions:
|
|