|
Characteristics of Estimators
Prerequisites
Measures
of Central Tendency, Variability,
Introduction to Sampling
Distributions, Introduction to Estimation,
Degrees of Freedom
Learning Objectives
- Define bias
- Define sampling variability
- Define expected value
- Define relative efficiency
This section discusses two important characteristics
of statistics used as point
estimates of parameters: bias
and sampling variability. Bias refers
to whether an estimator tends to either over or underestimate
the parameter. Sampling variability refers to how much the estimate
varies from sample to sample.
Bias
A statistic
is biased if the long-term average value of the statistic is not
the parameter
it is estimating. More formally, a statistic is biased if the
mean of the sampling
distribution of the statistic is not equal to the parameter.
The mean of the sampling distribution of a statistic is sometimes
referred to as the expected
value of the statistic.
As we saw in the section on the sampling distribution
of the mean, the mean of the sampling distribution of the (sample)
mean is the population
mean (μ). Therefore the sample mean is
an unbiased estimate of μ. Any given sample mean may underestimate
or overestimate μ, but, there is no systematic tendency for
sample means to either under or overestimate μ.
In the section on variability,
we saw that the formula for the variance in a population is

whereas the formula to estimate the variance from a sample is
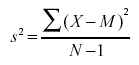
Notice that the denominators of the formulas are different: N
for the population and N-1 for the sample. We saw in the "Estimating
Variance Simulation" that if N is used in the formula
for s2, then the estimates tend to be
too low and therefore biased. The formula with N-1 in the denominator
gives an unbiased estimate of the population variance. Note that
N-1 is the
degrees of freedom.
Sampling Variability
The sampling variability of a statistic refers
to how much the statistic varies from sample to sample and is
usually measured by its standard
error ; the smaller the standard error, the less the sampling
variability. For example, the standard
error of the mean is a measure of the sampling variability
of the mean. Recall that the formula for the standard error of
the mean is

The larger the sample size (N), the smaller the
standard error of the mean and therefore the lower the sampling
variability.
Statistics differ in their sampling variability
even with the same sample size. For example, for normal distributions,
the standard error of the median is larger than the standard error
of the mean. The smaller the standard error of a statistic, the
more efficient the statistic. The relative
efficiency of two statistics is typically defined as the
ratio of their standard errors. However, it is sometimes defined
as the ratio of their squared standard errors.
|