Illustrated Instructions
The simulation is started by clicking the button in the lower left of the screen. Clicking this button begins a series of trials where a another button appears on the right and you will be asked to click this button as quickly as possible.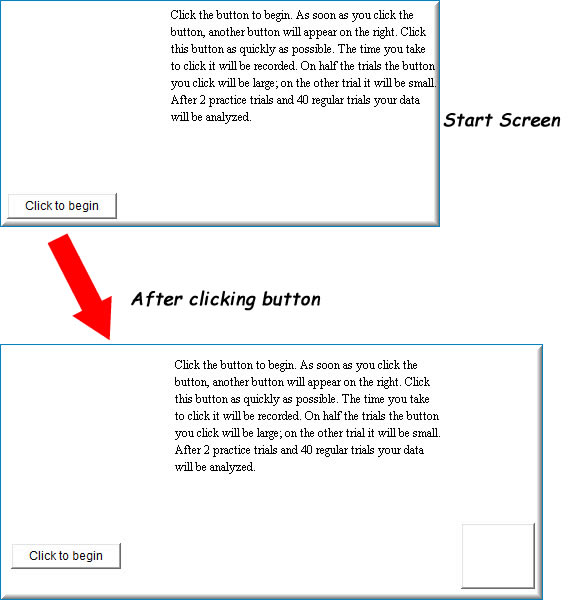
Half of the buttons will large and half will be small. Once you complete 40 trials, the simulation will show you descriptive statistics about the reaction time data for each button size (see screenshot below).
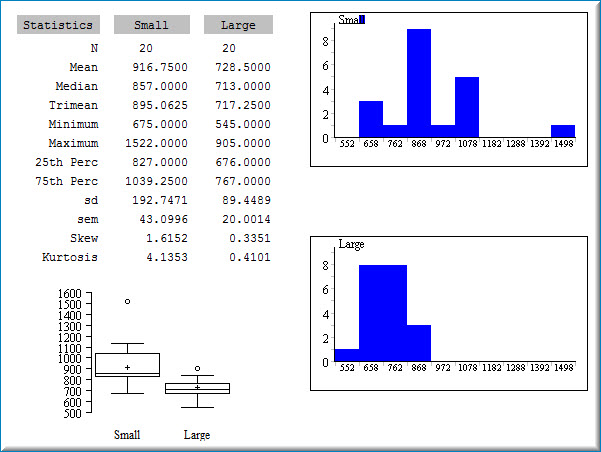
Follow the instructions accompanying the simulation. Compare the two distributions after completing the 40 trials. Are the differences what you expected?