|
|
Sugar Consumption in the US Diet between 1822 and 2005
Research conducted by: Stephan Guyenet and Jeremy Landen
Case study prepared by: Robert F. Houser and Georgette Baghdady
Overview
Sugar has many forms: cane sugar, beet sugar, honey, molasses, fruit juice concentrate, glucose, sucrose, fructose, high-fructose corn syrup, maple syrup, brown rice syrup, barley malt syrup, agave nectar, to list a few. High-fructose corn syrup, in particular, was introduced into the US food industry in the early 1970s and has become ubiquitous in processed foods and soft drinks. Many of the added sugars in packaged foods and beverages could be considered "hidden sugar" because, if we do not examine the ingredients list on food labels or know sugar's many aliases, we are most likely unaware of how much sugar we consume each day.
To explore sugar consumption trends in the US, researchers Stephan Guyenet and Jeremy Landen compiled data on caloric sweetener sales spanning 184 years. They extracted annual caloric sweetener sales per capita for 1822 to 1908 from US Department of Commerce and Labor reports, and for 1909 to 2005 from the US Department of Agriculture (USDA) web site. The researchers adjusted the sales data for post-production losses using the USDA's 1970-2005 loss estimate of 28.8 percent to obtain reasonable estimates of annual per capita consumption of added sugars. Post-production losses of a food commodity occur at the retail, foodservice and consumer levels from, for example, spoilage, pests, cooking losses and plate waste.
Guyenet presents a striking graph and regression analysis of sugar consumption in the US from 1822 to 2005 in a blog to promote awareness and discussion.
Questions to Answer
Do different time periods between 1822 and 2005 reveal different trends in sugar consumption in the US diet? Can a regression graph be used to make predictions outside the range of the study data?
Design Issues
The data represent added caloric sugars such as cane sugar, high-fructose corn syrup and maple syrup, not naturally occurring sugars such as those in fruits and vegetables. Thus the data do not represent total sugar consumption. The data are not direct measures of consumption, but rather estimates derived from sales figures by adjusting for losses before consumption. The adjustment, applied across all years, is based on the USDA loss estimate from 1970-2005, which may or may not underestimate sugar consumption in earlier time periods.
Descriptions of Variables
| Variable |
Description |
| year |
All years from 1822 to 2005 |
sugar_consum |
Estimated consumption of added sugars in the US diet in pounds per year per person |
| References |
|
Johnson, R. K., Appel, L. J., Brands, M., Howard, B. V., Lefevre, M., Lustig, R. H., Sacks, F., Steffen, L. M., Wylie-Rosett, J. (2009). Dietary sugars intake and cardiovascular health: A scientific statement from the American Heart Association. Circulation, 120, 1011-1020.
|
Links
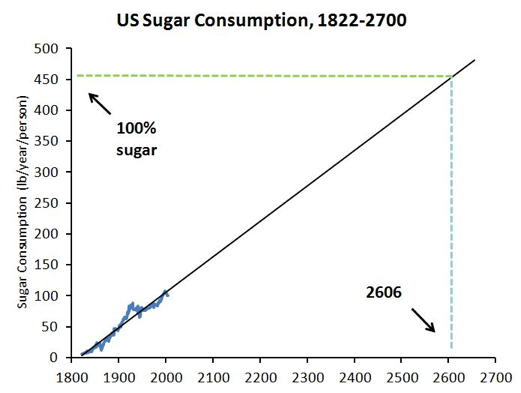
By 2606, the US Diet will be 100 Percent Sugar, a blog by Stephan Guyenet
How to Spot Added Sugar on Food Labels
Dietary Sugars Intake and Cardiovascular Health: A Scientific Statement From the American Heart Association
Sugar: The Bitter Truth, a lecture by Robert H. Lustig
60 Minutes: Is Sugar Toxic?
| Exercises |
Please read Stephan Guyenet’s blog, "By 2606, the US Diet will be 100 Percent Sugar," before performing the exercises. Below is Guyenet’s graph showing sugar consumption in the US in pounds per year per person as a function of year from 1822 to 2005.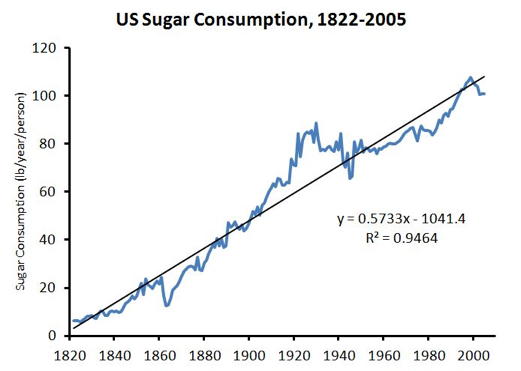
- In Guyenet’s graph,
- What does the blue line represent?
- What does the black line represent?
- Interpret R2 = 0.9464.
- In Guyenet’s graph, there are three prominent dips in sugar consumption between 1822 and 2005. What historical events were possibly influencing US sugar consumption from
- 1861 to 1865?
- 1930 to 1940?
- 1941 to 1945?
- For each time period below, create a scatter plot of sugar consumption by year. Perform a simple linear regression analysis and state the equation and R2 value. Display the regression line in each graph.
- 1822 to 2005 (that is, reproduce Guyenet's results)
- 1822 to 1930
- 1931 to 1960
- 1961 to 2005
- Compare and interpret your findings across the different time periods. What are the similarities and differences?
- Based on your findings, critique Guyenet's regression analysis of sugar consumption from 1822 to 2005.
- Guyenet's graph shows a downturn in US sugar consumption from 2000 to 2005. Why do you think there was a decline in this time period? Search the Internet for evidence to support your projection on whether or not sugar consumption has continued to decline since 2005.
- In 2009, the American Heart Association (AHA) issued recommended upper limits of intake for added sugars, specifically 100 calories or six teaspoons per day for women and 150 calories or nine teaspoons per day for men. Guyenet's data suggest that Americans consumed 100.84768 pounds of added sugars per person in 2005.
- How many calories per day per person did Americans consume from added sugars in 2005? (Use these conversion factors: One pound equals 453.592 grams. One year equals 365 days. Granulated sugar has 387 calories per 100 grams.)
- Express your result in terms of teaspoons of granulated sugar per day per person. (One teaspoon of granulated sugar has 16 calories.)
- How do your results compare with the AHA-recommended upper limits?
- What are some of the food sources of added sugars in the US diet?
- What are some of the possible health consequences of a diet high in sugar? (In addition to reading the AHA scientific statement, watch Lustig's lecture, "Sugar: The Bitter Truth" and 60 Minutes' presentation, "Is Sugar Toxic?")
- In the graph below, Guyenet extrapolates beyond 2005 to determine that year 2606 predicts a diet of 100 percent sugar. Note: An average US energy intake of 2,250 calories per day per person is equivalent to consuming 452.6 pounds of sugar per year per person. (Guyenet uses an approximate conversion factor, 1 gram of sugar = 4 calories.)
- What assumption did Guyenet make when extrapolating to year 2606? Is his assumption reasonable?
- Critique Guyenet's conclusion that "by 2606 the US diet will be 100 percent sugar."
 |
|
|