Testing Distribution Demonstration

If you are having problems with Java security, you might find this page helpful.


Learning Objectives
  1. Develop a basic understanding of the properties of a sampling distribution based on the properties of the population.

Instructions
In this simulation, 100 numbers are either sampled from a normal distribution or a uniform distribution. The frequencies in each of 10 "bins" is then displayed in the "observed" column. The expected frequencies based on both a normal distribution (on the left) or a uniform distribution (on the right) are shown just to the left of the observed frequencies. For each bin the value (E-O)2/E is computed where E is the expected frequency and O is the observed frequency. The sum of these quantities is the value of Chi Square shown at the bottom.

1. The default is to sample from a normal distribution. Click the sample button and 100 values will be sampled from a normal distribution. Compare the observed values in the "From a Normal Distribution" section to the expected values. Is the Chi Square test significant at the 0.05 level? How often would you expect it to be significant.
2. Compare the observed frequencies from the "From a Uniform Distribution" section to the expected frequencies. In what way are they different? Is the difference significant? If so, then the null hypothesis that the numbers were sampled from a uniform distribution could be rejected. Of course, in this simulation, you know where the numbers were sampled so you know the null hypothesis is false.
3. Simulate several experiments and see if the significance for the test of a uniform distribution is always significant.
4. Make the actual distribution a uniform distribution and do more simulated experiments. Compare the results to when the actual distribution was normal.

Illustrated Instructions
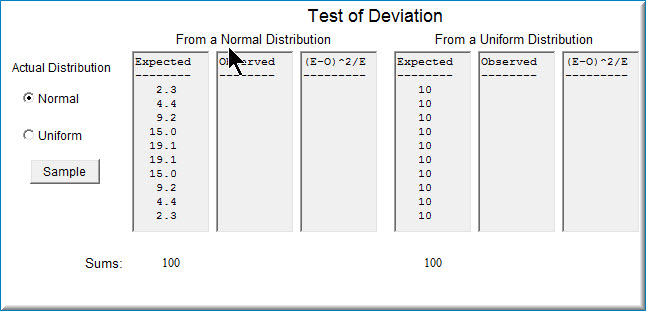
This simulation samples 100 values from a normal or uniform distribution and calulates the the Chi Square value. As can be seen from the image below, the simulation begins by displaying a table with expected frequencies. simulation
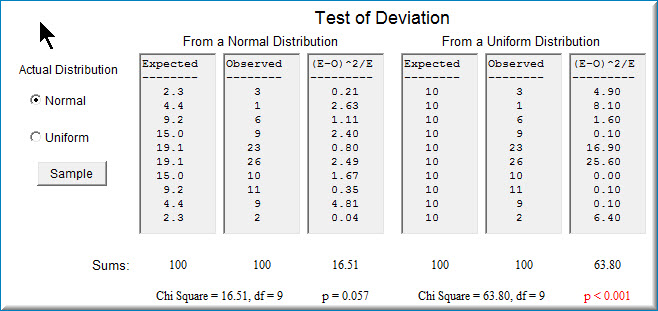
Clicking on the "Sample" button, samples 100 values from a normal distribution (by default) and displays the observed frequencies as well as the results of the Chi Square tests. simulation