|
|
Rank Randomization Two or More Conditions (Kruskal-Wallis)
Author(s)
David M. Lane
Prerequisites
Randomization Test for Two or More Conditions, Wilcoxon Test, Chi Square Distribution
Learning Objectives
- Compute the Kruskal-Wallis test
The Kruskal-Wallis test is a rank-randomization test that extends the Wilcoxon test to designs with more than two groups.
It tests for differences in central tendency in designs with one between-subjects variable. The test is based on a statistic H that is approximately distributed as Chi Square. The formula for H is shown below:
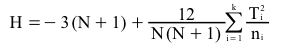
where
N is the total number of observations,
Ti is the sum of ranks for the ith group,
ni is the sample size for the ith group,
and k is the number of groups.
The first step is to convert the data to ranks (ignoring group membership) and then find the sum of the ranks for each group. Then, compute H using the formula above. Finally, the significance test is done using a Chi Square distribution with k-1 degrees of freedom.
For the "Smiles and Leniency" case study, the sums of the ranks for the four conditions are:
False: 2732.0
Felt: 2385.5
Miserable: 2424.5
Neutral: 1776.0
Note that since there are "ties" in the data, the mean rank of the ties is used. For example, there were 10 scores of 2.5 which tied for ranks 4-13. The average of the numbers 4, 5, 6, 7, 8, 9, 10, 11, 12, and 13 is 8.5. Therefore, all values of 2.5 were assigned ranks of 8.5.
The
sample size for each group is 34.

Using the Chi Square Calculator for Chi Square = 9.28 with 4-1 = 3 df results in a p value of 0.0258. Thus the null hypothesis of no leniency effect can be rejected.
Please answer the questions:
|
|