Instructions
This demonstration allows you to change the shape of a distribution and see the point at which the distribution
would balance.
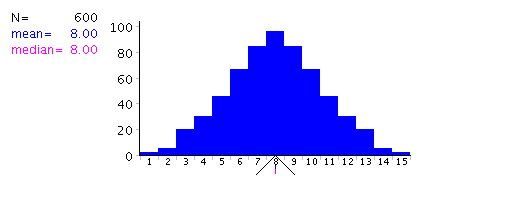
The graph in the right panel is a histogram of 600 scores. The mean and median are equal to 8 and are indicated by
small vertical bars on the X axis The top portion of the bar is in blue and represents the mean. The bottom portion is
in pink and represents the median. The mean and median are also shown to the left of the Y axis.
You can see that the histogram is balanced on the tip of the triangle (the fulcrum).
You can change the shape of the histogram by painting with the mouse. Notice that the triangle beneath
the X-axis automatically moves to the point where the histogram is balanced. Experiment with different shapes and see
if you can determine whether there is a relationship between the mean, median, and/or the mode and the
location of the balance point.
Illustrated Instructions
Below is a screen shot of the simulaton's beginning screen. Note that the distribution is balanced on the fulcrum.
The mean and median are shown to the left and also as small vertical bars below the X-axis. The mean is in blue
and the median is in pink. The next figure illustrates this more clearly.
You can change the distribution by painting with the mouse when running the simulation.
 Below is an example of the distribution after it has been changed.
Note that the mean and median are marked by vertical lines.
Below is an example of the distribution after it has been changed.
Note that the mean and median are marked by vertical lines.
