Inferential Statistics
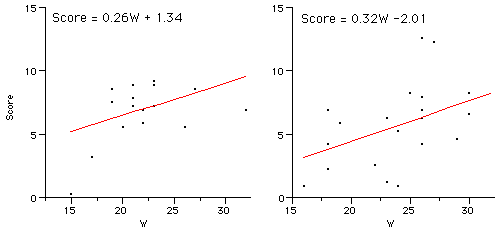
Analysis of covariance assumes the regression slopes are equal. This assumption is called homogeneity of regression slopes. The regression slopes for the two conditions are quite similar as shown below.
The slopes are not significantly different, F(1,34) = 0.091, p = 0.765. One way to conduct this test is to compare the sum of squares explained for a model including Group, Wonderlic, and the crossproduct of Group and Wonderlic shown below
![]()
with a model containing only Group and Wonderlic.
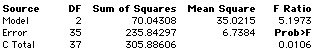
The former sum of squares is 70.67410 and the latter sum of squares is 70.04308. The F test is computed by taking the difference between the sums of squares, dividing by the degrees of freedom (1 in this case because the difference in df for the two models is 1) and dividing by the MSE from the model with all three effects in it (6.9180). The resulting F ratio is 0.0912. The p value of 0.7645 does not approach significance so there is no evidence that the regression lines have different slopes.
Of course, most computer programs will compute this F for you as shown below.
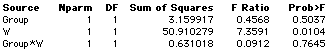
Notice that the Group x W interaction is the test of homogeneity of regression slopes. Very important: Do not interpret the significance test of the main effect of a variable in a model in containing the crossproduct of the variable with a quantitative variable. In this case do not interpret the effect of Group since the Group x Wonderlic crossproduct is in the model. .
Since there is no evidence that the regression slopes are different, the next step is to consider a model containing the variables Group and Wondelic. The analysis is shown below.
![]()
This analysis is traditionally called analysis of covariance (ANCOVA). The key finding is the effect of Group is significant. Therefore, it can be concluded that the HAL interface leads to better performance than the 1-2-3 interface.