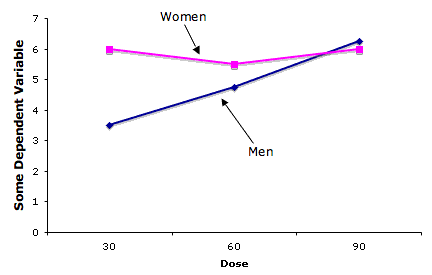
Interaction Plot
An interaction plot displays the levels of one variable on
the X axis and has a separate line for the means of each level of the other
variable. The Y axis is the dependent variable. A look at this graph shows
that the effect of dosage is different for males than it is for females. See
also: interaction.