|
Measurement
Author(s)
David M. Lane
Prerequisites
Values of Pearson's Correlation, Variance Sum Law, Measures of Variability
- Define reliability
- Describe reliability in terms of true scores and error
- Compute reliability from the true score and error variance
- Define the standard error of measurement and state why it is valuable
- State the effect of test length on reliability
- Distinguish between reliability and validity
- Define three types of validity
- State the how reliability determines the upper limit to validity
The collection of data involves measurement. Measurement of some characteristics such as height and weight are relatively straightforward. The measurement of psychological attributes such as self esteem can be complex. A good measurement scale should be both reliable and valid. These concepts will be discussed in turn.
Reliability
The notion of reliability revolves around whether you would get at least approximately the same result if you measure something twice with the same measurement instrument. A common way to define reliability is the correlation between parallel forms of a test. Letting "test" represent a parallel form of the test, the symbol rtest,test is used to denote the reliability of the test.
True Scores and Error
Assume you wish to measure a person's mean response time to the onset of a stimulus. For simplicity, assume that there is no learning over tests which, of course, is not really true. The person is given 1,000 trials on the task and you obtain the response time on each trial.
The mean response time over the 1,000 trials can be thought of as the person's "true" score, or at least a very good approximation of it. Theoretically, the true score is the mean that would be approached as the number of trials increases indefinitely.
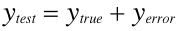
An individual response time can be thought of as being composed of two parts: the true score and the error of measurement. Thus if the person's true score were 345 and their response on one of the trials were 358, then the error of measurement would be 13. Similarly, if the response time were 340, the error of measurement would be -5.
Now consider the more realistic example of a class of students taking a 100-point true/false exam. Let's assume that each student knows the answer to some of the questions and has no idea about the other questions. For the sake of simplicity, we are assuming there is no partial knowledge of any of the answers and for a given question a student either knows the answer or guesses. Finally, assume the test is scored such that a student receives one point for a correct answer and loses a point for an incorrect answer. In this example, a student's true score is the number of questions they know the answer to and their error score is their score on the questions they guessed on. For example, assume a student knew 90 of the answers and guessed correctly on 7 of the remaining 10 (and therefore incorrectly on 3). Their true score would be 90 since that is the number of answers they knew. Their error score would be 7 - 3 = 4 and therefore their actual test score would be 90 + 4.
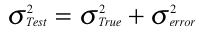
Every test score can be thought of as the sum of two independent components, the true score and the error score. This can be written as:
The following expression follows directly from the Variance Sum Law:
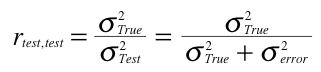
Reliability in Terms of True Scores and Error
It can be shown that the reliability of a test, rtest,test, is the ratio of true-score variance to test-score variance. This can be written as:
Download PDF of derivation
It is important to understand the implications of the role the variance of true scores plays in the definition of reliability: If a test were given in two populations for which the variance of the true scores differed, the reliability of the test would be higher in the population with the higher true-score variance. Therefore, reliability is not a property of a test per se but the reliability of a test in a given population.
Assessing Error of Measurement
The reliability of a test does not show directly how close the test scores are to the true scores. That is, it does not reveal how much a person's test score would vary across parallel forms of test. By definition, the mean over a large number of parallel tests would be the true score. The standard deviation of a person's test scores would indicate how much the test scores vary from the true score. This standard deviation is called the standard error of measurement. In practice, it is not practical to give a test over and over to the same person and/or assume that there are no practice effects. Instead, the following formula is used to estimate the standard error of measurement.
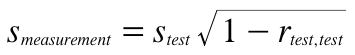
where smeasurement is the standard error of measurement, stest is the standard deviation of the test scores, and rtest,test is the reliability of the test. Taking the extremes, if the reliability is 0 then the standard error of measurement is equal to the standard deviation of the test; if the reliability is perfect (1.0) then the standard error of measurement is 0.
Increasing Reliability
It is important to make measures as reliable as is practically possible. Suppose an investigator is studying the relationship between spatial ability and a set of other variables. The higher the reliability of the test of spatial ability, the higher the correlations will be. Similarly, if an experimenter seeks to determine whether a particular exercise regiment decreases blood pressure, the higher the reliability of the measure of blood pressure, the more sensitive the experiment. More precisely, the higher the reliability the higher the power of the experiment. Power is covered in detail here. Finally, if a test is being used to select students for college admission or employees for jobs, the higher the reliability of the test the stronger will be the relationship to the criterion.
Two basic ways of increasing reliability are (1) to improve the quality of the items and (2) to increase the number of items. Items that are either too easy so that almost everyone gets them correct or too difficult so that almost no one gets them correct are not good items: they provide very little information. In most contexts, items which about half the people get correct are the best (other things being equal).
Items that do not correlate with other items can usually be improved. Sometimes the item is confusing or ambiguous.
Increasing the number of items increases reliability in the manner shown by the following formula:
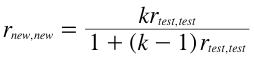
where k is the factor by which the test length is increased, rnew,new is the reliability of the new longer test, and rtest,test is the current reliability. For example, if a test with 50 items has a reliability of .70 then the reliability of a test that is 1.5 times longer (75 items) would be calculated as follows
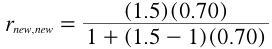
which equals 0.78. Thus increasing the number of items from 50 to 75 would increase the reliability from 0.70 to 0.78.
It is important to note that this formula assumes the new items have the same characteristics as the old items. Obviously adding poor items would not increase the reliability as expected and might even decrease the reliability.
More Information on Reliability from William Trochim's Knowledge Source
Validity
The validity of a test refers to whether the test measures what it is supposed to measure. The three most common types of validity are face validity, empirical validity, and construct validity. We consider these types of validity below.
Face Validity
A test's face validity refers to whether the test appears to measure what it is supposed to measure. That is, does the test "on its face" appear to measure what it is supposed to be measuring. An Asian history test consisting of a series of questions about Asian history would have high face validity. If the test included primarily questions about American history then it would have little or no face validity as a test of Asian history.
Predictive Validity
Predictive validity (sometimes called empirical validity) refers to a test's ability to predict the relevant behavior. For example, the main way in which SAT tests are validated is by their ability to predict college grades. Thus, to the extent these tests are successful at predicting college grades they are said to possess predictive validity.
Construct Validity
Construct validity is more difficult to define. In general, a test has construct validity if its pattern of correlations with other measures is in line with the construct it is purporting to measure. Construct validity can be established by showing a test has both convergent and divergent validity. A test has convergent validity if it correlates with other tests that are also measures of the construct in question. Divergent validity is established by showing the test does not correlate highly with tests of other constructs. Of course, some constructs may overlap so the establishment of convergent and divergent validity can be complex.
To take an example, suppose one wished to establish the construct validity of a new test of spatial ability. Convergent and divergent validity could be established by showing the test correlates relatively highly with other measures of spatial ability but less highly with tests of verbal ability or social intelligence.
Reliability and Predictive Validity
The reliability of a test limits the size of the correlation between the test and other measures. In general, the correlation of a test with another measure will be lower than the test's reliability. After all, how could a test correlate with something else as high as it correlates with a parallel form of itself? Theoretically it is possible for a test to correlate as high as the square root of the reliability with another measure. For example, if a test has a reliability of 0.81 then it could correlate as high as 0.90 with another measure. This could happen if the other measure were a perfectly reliable test of the same construct as the test in question. In practice, this is very unlikely.
A correlation above the upper limit set by reliabilities can act as a red flag. For example, Vul, Harris, Winkielman, and Paschler (2009) found that in many studies the correlations between various fMRI activation patterns and personality measures were higher than their reliabilities would allow. A careful examination of these studies revealed serious flaws in the way the data were analyzed.
Vul, E., Harris, C., Winkielman, P., & Paschler, H. (2009) Puzzlingly High Correlations in fMRI Studies of Emotion, Personality, and Social Cognition. Perspectives on Psychological Science, 4, 274-290.
Please answer the questions:
|