Reading the Data
Choose Import from the file menu and select "Text/Others..." Then select the dataset. JMP will read in the data and name the variable Column 1 and Column 2. Edit the names by selecting the old names and typing new names. Column 1 is condition and Column 2 is leniency.
Quantile Plots
With the mouse specify "condition" as an "X" variable and "leniency" as a Y variable.

From the menu bar choose Analyze/Fit Y by X. The data are plotted as a function of condition. The graph displayed in the section on descriptive statistics was computed using only the "Quantile Boxes" and "Means Dots, Error Bars" options of the "Display" pop-up menu.
Descriptive statistics
After choosing Analyze/Fit Y by X as described in the section on Quantile plots, choose "Means, Std Dev, Std Err from the analysis pop-up menu. See results.
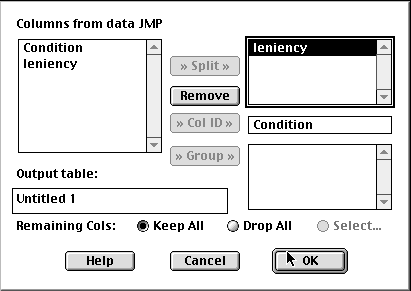
For more detailed descriptive statistics: Remove the "X" for Condition but leave the "Y" for leniency at the top of the data table. From the Tables menu choose "Split Columns." Click on "Condition" and then click on "Col ID". The dialog box should look like the one shown below. Click "OK."

Click "OK" and a new data table will be created with four columns, one for each condition. Each will be marked as "Y". Choose "Analyze/Distribution of Y" from the menu. Click and hold "Moments" and choose "More moments for each variable.
See results
Comparing the average of the three smile conditions with the control
If you haven't already done so, use the mouse to specify "condition" as an "X" variable and "leniency" as a Y variable. Then choose Analyze/Fit model from the menu. The following dialog box will appear:
Note that leniency is the Y variable and Condition is an effect in the model. Click "Run Model."
There will be quite a bit of output. On the right side of the output will be a label for "Condition." Click and hold down the arrow and choose "Add contrast."The dialog box shown below will appear at the lower right hand portion of the output. Click the plus sign for false, felt, miserable. Click the minus sign for neutral. Then click the "Done" button.

See results
Comparisons among the three smile conditions
Comparisons among the three smile conditions. As in the contrast of the average smile condition with the control, choose "Add contrast." Click the plus sign for false and the minus sign for felt. Then click "New Column." Now click the plus sign for false, the minus sign for miserable, and click "New Column." Finally, click the plus sign for felt, the minus sign for miserable, and click done.
See results
Comparing each smile condition with the control
With the mouse specify "condition" as an "X" variable and "leniency" as a Y variable.

From the menu bar choose Analyze/Fit Y by X.Click on any point from the neutral condition and then choose "Compare with Control" from the analysis menu.
See results