|
|
Exercise and Memory
Research conducted by: M. E. Hopkins, F. C. Davis, M. R. Van Tieghem, P. J. Whalen, and D. J. Bucci
Case study prepared by: Robert F. Houser and Georgette Baghdady
Overview
Physical exercise has many beneficial effects on physiological processes, including those that affect cognition and memory. Exercise increases brain-derived neurotrophic factor (BDNF), which is a protein found in the learning and memory centers of the brain where it supports nerve cell survival and the growth of new neurons and neuronal connections. A polymorphism of BDNF (a variant genotype) alters the release of BDNF during exercise. The researchers of this study sought to compare the effects of a single bout of exercise versus a 4-week exercise regimen on cognition and memory and to determine if BDNF genotype influences the intensity of those effects of exercise.
Questions to Answer
How do regular exercise and/or an acute bout of exercise affect cognitive memory? Does type of BDNF genotype (Val/Val or Met carrier) mediate the effect of exercise on memory? How do we calculate a one-way ANOVA by hand and how do different post-hoc tests compare?
Design Issues
The group sample sizes are small, perhaps limiting the power to detect significant differences between the four exercise/control groups.
Descriptions of Variables
| Variable |
Description |
| Group |
0W-: sedentary group
0W+: sedentary group with one bout of exercise at least 2 hours before Visit 2
4W-: regularly exercising group
4W+: regularly exercising group with a bout of exercise at least 2 hours before Visit 2 |
Accuracy |
The percentage of objects each group accurately identified as old or new when performing the novel object recognition task during each study visit |
| Difference score |
Accuracy achieved by the subject in the novel object recognition task during Visit 2 minus accuracy during Visit 1, in percent |
| BDNF genotype |
Whether a subject's BDNF genotype is Val/Val or Met carrier (Val/Met and Met/Met) |
| References |
Hopkins, M. E., Davis, F. C., Van Tieghem, M. R., Whalen, P. J., Bucci, D. J. (2012). Differential effects of acute and regular physical exercise on cognition and affect. Neuroscience, 215, 59-68. |
Links How Exercise Affects the Brain: Age and Genetics Play a Role
BDNF
| Exercises |
The following table contains the mean, standard error of the mean (SEM), and sample size for the difference in scores between Visit 2 and Visit 1 (Visit 2 score Visit 1 score) on the object recognition memory test for each of the three exercise groups and control group. The data are illustrated in Figure 3B of the article as a bar graph.
| Group |
Mean |
SEM |
SD |
Sample size (n) |
0W-
(sedentary group) |
-4.50 |
2.08 |
|
13 |
4W-
(regularly exercising group) |
-4.90 |
1.60 |
|
14 |
4W+
(regularly exercising group with a bout of exercise at least two hours before Visit 2 |
2.42 |
2.36 |
|
12 |
0W+
(sedentary group with one bout of exercise at least two hours before Visit 2) |
-2.50 |
1.50 |
|
15 |
- Calculate the standard deviations (SD) for the four groups and record the values you obtain in the table. Recall that SEM = SD/√n. Report SD values to six decimal places.
Do the mean difference scores for accuracy in the novel object recognition task (i.e., accuracy during Visit 2 minus accuracy during Visit 1) differ significantly among the four groups (0W-, 4W-, 4W+, 0W+)? To answer this question, you first need to perform a one-way ANOVA, which you will do by hand since we do not have the raw data.
- What is the null hypothesis for the one-way ANOVA? What is the alternative hypothesis?
The following table contains all of the formulas you will need to calculate the F statistic of a one-way ANOVA.
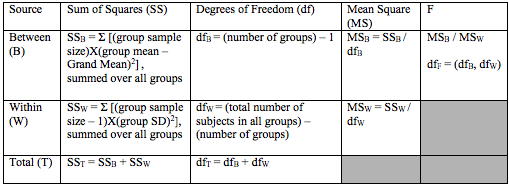
- First, you need to calculate the Grand Mean, which is used in the calculation of the Sum of Squares Between. The Grand Mean equals the weighted average of the four group means using the respective group sample sizes as the weights. Write out the equation and report the value.
- Use the formulas presented in the above table to calculate the F statistic for comparing the means of the four groups (0W-, 4W-, 4W+, 0W+). Fill in the table below with the values you obtain.
| Source |
Sum of Squares (SS) |
Degrees of Freedom (df) |
Mean Square (MS) |
F |
| Between |
|
|
|
|
| Within |
|
|
|
|
| Total |
|
|
|
|
- The degrees of freedom for the F statistic is the pair of numbers dfB (from the numerator) and dfW (from the denominator). Use the online calculator that computes the probability for the F distribution.
- In the article, the authors used independent samples t tests. Perform independent samples t tests based on p<0.05 for the six possible comparisons shown in the table below and fill in the values you obtain. Interpret your results based on what the group notations represent. For example, comparing 4W- versus 4W+ determines whether or not a bout of exercise a few hours before engaging in a task requiring cognition and memory improves performance on that task in regularly-exercising individuals.
| Pairwise comparison |
t statistic |
p value |
| 0W-, 4W- |
|
|
| 0W-, 4W+ |
|
|
| 0W-, 0W+ |
|
|
| 4W-, 4W+ |
|
|
| 4W-, 0W+ |
|
|
| 4W+, 0W+ |
|
|
- Now apply the Bonferroni correction. Since you performed six pairwise comparisons, two means will be considered statistically significantly different if the p value is less than 0.05 / 6 = 0.0083. Based on the Bonferroni correction, are the pairwise comparisons that were statistically significant in Exercise #6 still statistically significant? If yes, which ones?
- The Tukey HSD test is the most commonly used post-hoc test following an ANOVA. Perform the Tukey HSD test for the pairs of means that you found to be statistically significant in Exercise #6. The formula and link for the test's Q statistic are given below.
The Q statistic for the Tukey HSD test is computed as follows:
Q = (Mi – (Mj) / [√(MSW / harmonic mean)],
where
Mi is one mean,
Mj is the other mean,
MSW is the value you calculated in Exercise #4,
and the harmonic mean = 2 / (1/ni + 1/nj), where the n's are the sample sizes in the pairwise comparison
Use the Studentized Range Distribution to obtain the p value. Based on the Tukey tests, are the pairwise comparisons that were statistically significant in Exercise #6 still statistically significant? If so, which ones?
- Which of the post-hoc approaches was/were the most conservative with these data?
- Determine the effect size attributable to groups, that is, the proportion of the variance among subjects' difference scores that is attributable to the experimental group they were in. Use the formula presented in the chapter on effect size:
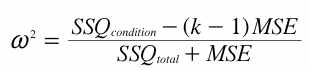 . Interpret your result. Figure 3C in the article shows a bar graph of the difference scores in each of the four groups (0W-, 4W-, 4W+, 0W+) stratified by the subjects' BDNF genotype, either Val/Val or Met carrier. . Interpret your result. Figure 3C in the article shows a bar graph of the difference scores in each of the four groups (0W-, 4W-, 4W+, 0W+) stratified by the subjects' BDNF genotype, either Val/Val or Met carrier.
- For the 4W+ group, perform an independent samples t test based on p<0.05 to compare the mean difference scores between subjects with Val/Val genotype and those who are Met carriers. What do you conclude?
| GROUP |
VAL/VAL |
MET CARRIER |
| |
Mean |
SEM |
SD |
n |
Mean |
SEM |
SD |
n |
| 4W+ |
7.5 |
2.97 |
7.2749 |
6 |
-2.7 |
2.3 |
5.6338 |
6 |
- How did the researchers formulate their predictions about exercise and memory in humans?
- What physiological mechanism(s) do the authors propose that support their findings?
|
|
|